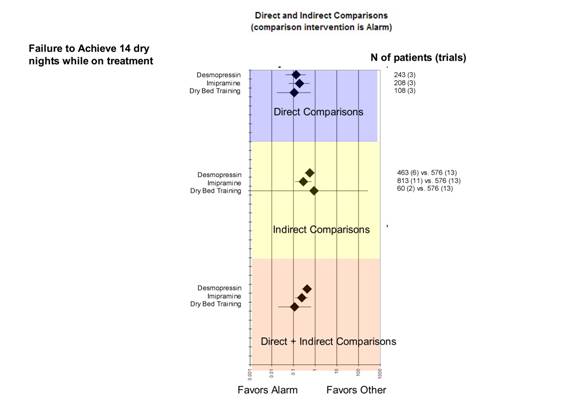
Figure 22.3.c: Example of a ‘forest top plot’ comparing interventions for enuresis in children.
This example was prepared using Microsoft Excel